S&P Global Offerings
Featured Topics
Featured Products
Events
S&P Global Offerings
Featured Topics
Featured Products
Events
S&P Global Offerings
Featured Topics
Featured Products
Events
Featured Products
Ratings & Benchmarks
By Topic
Market Insights
About S&P Global
Corporate Responsibility
Diversity, Equity, & Inclusion
Investor Relations
Featured Products
Ratings & Benchmarks
By Topic
Market Insights
About S&P Global
Corporate Responsibility
Diversity, Equity, & Inclusion
Investor Relations
S&P Global Offerings
Featured Topics
Featured Products
Events
Language
S&P Dow Jones Indices — 20 Nov, 2020
I define core ESG indexing as the use of indices designed to apply environmental, social, and governance (ESG) screening and ESG scores to recognized and sometimes iconic indices like the S&P 500®(opens in a new tab), S&P/ASX 200(opens in a new tab), or S&P/TSX Composite(opens in a new tab). These headline indices become actionable components of asset allocation when a fund or separately managed accounts (SMA) provider tracks the index. Our SPIVA® and Persistence Scorecards(opens in a new tab) prove time and again that these well-designed indices are fit for that purpose. Now we have designed and launched core ESG versions of these indices to leverage SAM’s1 robust ESG data to measure the ESG engagement of companies in the benchmark index. Looking at the cost and availability of the ETFs that currently exist in the U.S., U.K./Europe, Canada, and Australia in this core ESG category, it is fair to say that the partnership of index providers, ETF data providers, asset managers, and market makers has democratized access to ESG for strategic allocation. But it’s okay with me if you prefer to think of that use of ESG as thematic rather than strategic.
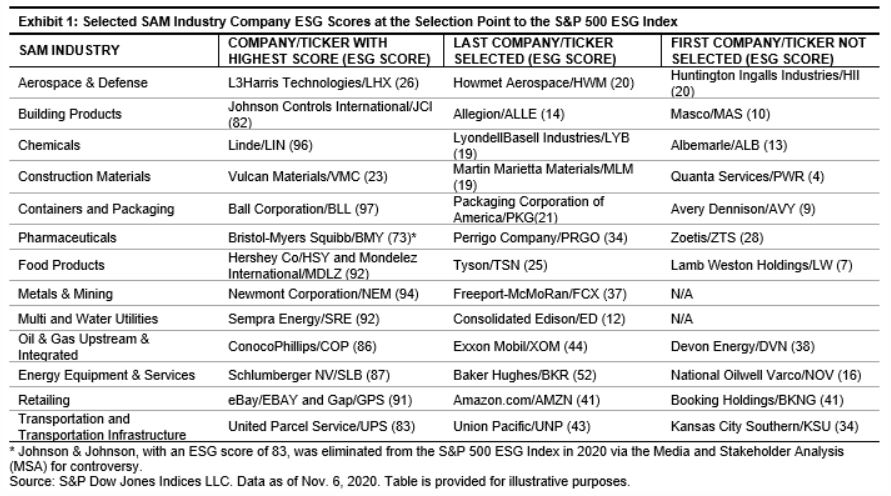
How exactly is core ESG indexing engaged to drive the types of change that ESG investors want to see? At first glance, most core ESG indices are not excluding as many industries or companies as ESG “leader” indices. The conscious design difference in core ESG has helped to historically ensure that core ESG indices track their benchmark closely. Yet the core ESG selection of eligible companies based on ESG score leads to industry and sector differences we can see. Exhibit 1 shows the last company selected and the next company not selected based on ESG scores for some of the industries within the S&P 500. Sector weight information is available free on spglobal.com/spdji(opens in a new tab), showing sector weight differences between benchmark and ESG indices.

At the company level, our expectation is that CFOs are engaged in addressing ESG inquiries from firms like SAM. SAM accesses both public and non-public information to render scores. This inquiry and reporting drives people and process changes at these companies as they attempt to improve year over year. And those same CFOs try to ensure their company is selected in core ESG indices. As investor demand for ESG continues to increase, my expectation is that selection in the S&P 500 ESG Index(opens in a new tab) will matter to CFOs in a similar way to how selection matters in one of our Dividend Aristocrats® indices.
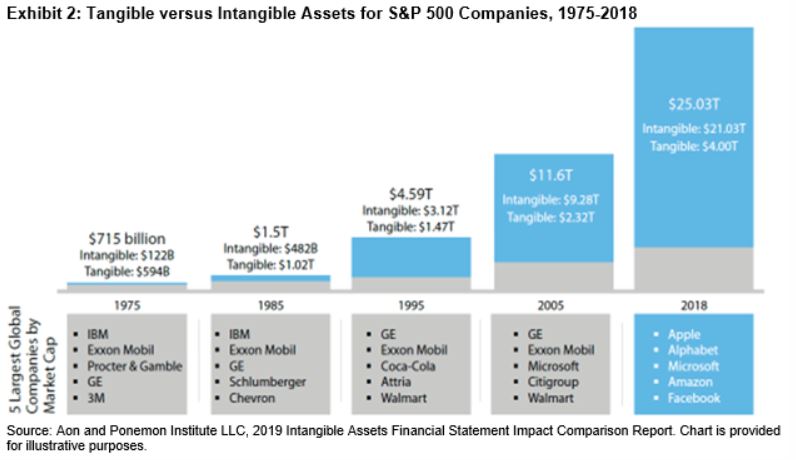
Another aspect of engagement that core ESG indices drive is bringing more transparency to how companies are managing material nonfinancial risks and opportunities. Is that information relevant to company valuation? A growing field of accountancy as well as education and training practice led by universities and the Sustainability Accounting Standards Board (SASB) are making that point, and I think that point is often missed by advisors and investors of my generation. We were trained to look at the three financial statements of the firm. We may need to have it pointed out to us how substantial the shift has been in valuation to intangible assets. Exhibit 2 illuminates this point in the ubiquitous S&P 500 by showing how intangible assets have increased significantly as a driver of market capitalization for the top five companies in the index over time.

Exhibit 2 shows that we need to be more curious about how ESG can provide information about intangible assets and nonfinancial risks and opportunities. More information and data from ESG data providers like SAM will paint a more complete picture of how to measure the long-term sustainable performance of equity and fixed income asset classes.
1 SAM, part of S&P Global, provides the data that powers the globally recognized Dow Jones Sustainability Indices, S&P 500 ESG Index, and others in the S&P ESG Index Series. Each year, SAM conducts the Corporate Sustainability Assessment, an ESG analysis of over 7,300 companies. The CSA has produced one of the world’s most comprehensive databases of financially material sustainability information, and serves as the basis for the scores that govern S&P DJI ESG indices.
The posts on this blog are opinions, not advice. Please read our Disclaimers.
Content Type
Location
Segment
Language
